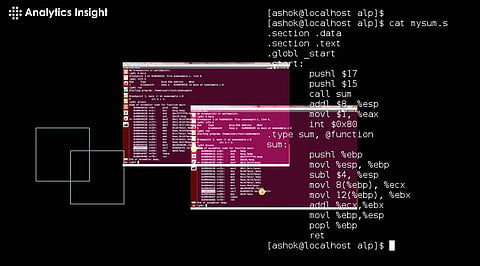

Debugging assembly programs can be both challenging and rewarding. Assembly language provides granular control over a machine’s hardware, making it the preferred choice for system-level programming and performance-critical applications. However, its complexity and lack of abstractions increase the risk of errors and make debugging a daunting task. Developers need specialized tools and techniques to identify and resolve issues effectively.
This article explores various strategies and tools used to debug assembly programs, enabling developers to gain deeper insights into their code, locate errors, and optimize performance.
Before exploring the tools and techniques, it's crucial to understand the unique challenges associated with debugging assembly code:
Complex Syntax: Assembly language uses low-level instructions, registers, and memory addresses, making the code harder to read and understand compared to high-level languages.
Lack of Error Handling: Unlike high-level languages, assembly provides no built-in error handling or debugging support, making it difficult to trace and fix bugs.
Direct Hardware Interaction: Debugging hardware-specific issues or working with peripherals requires intimate knowledge of the architecture and environment, complicating the debugging process.
Memory Management: Handling memory manually increases the risk of segmentation faults and memory leaks, which can cause unpredictable behavior or crashes.
Understanding these challenges is the first step toward efficient debugging. With the right set of tools and techniques, developers can overcome these obstacles and enhance their productivity.
Debugging tools for assembly vary depending on the architecture, operating system, and type of application being developed. Here are some of the most commonly used tools:
GDB is a powerful tool for debugging assembly programs, especially for Linux-based systems. It supports multiple architectures, making it versatile. GDB enables developers to view register states, inspect memory, step through instructions, and set breakpoints in the code.
Key Features:
Step-by-step execution of instructions
Inspection of register and memory values
Setting breakpoints and watchpoints
Stack trace analysis for function calls
GDB is often used with objdump and readelf for deeper insights into the binary
IDA Pro is a professional-grade tool designed for reverse engineering and debugging binary code. It provides both a disassembler and debugger, making it invaluable for understanding compiled assembly code. The tool offers a visual interface, making it easier to navigate complex code.
Key Features:
Static analysis of assembly code
Dynamic debugging with register and memory inspection
Pseudocode generation for better readability
Integration with other tools like Hex-Rays decompiler
IDA Pro is widely used for debugging malware and system-level programs where source code is unavailable.
WinDbg is a Windows-specific debugger provided by Microsoft. It’s suitable for debugging Windows kernel-mode and user-mode applications, making it the go-to tool for system-level Windows development. It provides a variety of commands and extensions for in-depth analysis.
Key Features:
Support for kernel-mode debugging
Analysis of system crashes and dumps
Capability to debug device drivers and hardware-related code
WinDbg is often used with the Debugging Tools for Windows package, which provides additional utilities like KD (Kernel Debugger).
OllyDbg is a popular, user-friendly debugger for Windows assembly programs. It focuses on binary analysis and is frequently used for reverse engineering. Its visual interface and intuitive design make it accessible to beginners.
Key Features:
Dynamic debugging with real-time updates
Code analysis and breakpoint management
Visualization of stack, registers, and memory
OllyDbg is preferred for debugging malware and binary analysis, where understanding the behavior of a program is crucial.
Radare2 is an open-source framework for reverse engineering and debugging. It provides a command-line interface for detailed analysis and debugging. Although it has a steep learning curve, Radare2 is extremely powerful for those comfortable with command-line tools.
Key Features:
Multi-platform support for various architectures
Static and dynamic analysis capabilities
Scripting and automation support for repetitive tasks
Integration with various plugins and extensions
Radare2 is widely used for reverse engineering, making it a favorite among security researchers and advanced developers.
Having the right tools is only part of the equation. Effective debugging requires mastering specific techniques. Below are some tried-and-tested methods to debug assembly programs effectively:
Setting breakpoints allows you to halt execution at specific points in the code. This helps isolate problematic sections and analyze the state of registers and memory. Single-stepping through instructions, one at a time, reveals how the program modifies register values and interacts with memory.
Breakpoints are particularly useful when dealing with loops and conditional statements. By stepping through each instruction, developers can validate that the control flow and data values behave as expected.
Understanding how the program modifies registers and memory locations is crucial in assembly debugging. Use the debugger to inspect the values of key registers like EAX, EBX, and others at different stages of execution. Identify discrepancies in values and analyze how memory addresses are accessed and modified.
Memory-related bugs, such as buffer overflows or invalid memory access, often result from incorrect pointer arithmetic or improper handling of memory addresses. Careful inspection of memory helps identify such issues early.
The stack is integral to function calls and local variable storage. Analyzing the stack during debugging helps trace function calls, identify parameter values, and understand the context of nested functions. This is particularly important in recursive functions and deeply nested calls where stack corruption or overflow can occur.
Stack tracing also reveals information about function prologues and epilogues, which is essential for understanding how parameters are passed and results are returned.
Setting conditional breakpoints stops execution only when specific conditions are met, such as when a register value exceeds a threshold. This reduces the time spent debugging loops or frequently executed code.
Watchpoints, on the other hand, halt execution when a particular memory location is accessed or modified. They are useful for monitoring changes in critical memory areas, such as global variables or hardware registers.
Control flow graphs and disassembly views provide a high-level perspective of the program’s execution. These views help visualize branches, loops, and conditional statements. Analyzing the control flow graph highlights potential dead code, infinite loops, or unreachable code segments.
Use these visual aids to understand how the program flows and interacts with different modules or libraries.
Debugging assembly programs requires patience, practice, and proficiency with specialized tools. While GDB and IDA Pro offer comprehensive support, tools like WinDbg and OllyDbg are ideal for Windows environments. Techniques such as breakpoint management, register inspection, and stack tracing enable developers to pinpoint issues and optimize code efficiently.
