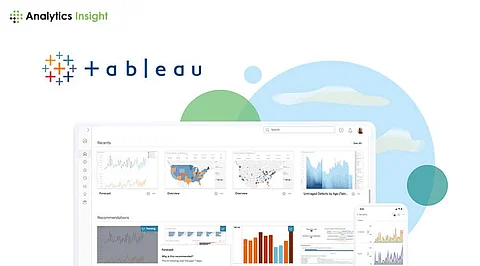

Tableau has become an invaluable tool in the field of data science, empowering analysts and data scientists to visualize, explore, and communicate insights from complex datasets effectively. While Tableau is renowned for its intuitive visualization capabilities, its utility extends beyond basic charting to encompass advanced analytics, predictive modeling, and data storytelling.
Before embarking on any data analysis or visualization project, it's essential to ensure that your data is clean, accurate, and well-prepared. Tableau offers robust data preparation tools that allow you to clean, transform, and shape your data easily. Mastering topics such as data connection, data blending, and data cleansing within Tableau can streamline your data preparation workflows and ensure that your analyses are based on reliable data.
Exploratory Data Analysis (EDA) is a critical step in the data science process, involving the initial exploration and visualization of datasets to uncover patterns, trends, and anomalies. Tableau's intuitive interface and powerful visualization capabilities make it an ideal tool for EDA. Learn how to create insightful visualizations, identify correlations, and spot outliers within Tableau to gain a deeper understanding of your data before diving into more advanced analyses.
Tableau goes beyond basic visualization to offer advanced analytics and calculation capabilities that enable you to perform complex analyses directly within the platform. Topics such as calculated fields, table calculations, and LOD (Level of Detail) expressions allow you to perform sophisticated calculations, predictive modeling, and statistical analyses without the need for additional tools or programming languages. Mastering these topics can elevate your data science skills and unlock new insights from your data.
Tableau seamlessly integrates with external machine learning and statistical tools, allowing you to leverage the power of these tools within the Tableau environment. Learn how to connect Tableau to popular machine-learning platforms such as Python and R, and use the results of machine-learning models to enrich your visualizations and analyses. By combining Tableau's visualization capabilities with the predictive power of machine learning, you can create compelling data-driven narratives and drive more informed decision-making.
Effective data storytelling is essential for communicating insights and driving action from your data. Tableau offers features such as dashboards, story points, and interactive visualizations that enable you to craft compelling narratives and engage your audience effectively. Mastering the art of data storytelling within Tableau can help you communicate complex analyses in a clear, concise, and impactful manner, making your insights more accessible and actionable.
Tableau is a powerful tool that enhances the practice of data science by providing intuitive visualization, advanced analytics, and seamless integration with machine learning and statistical tools. By mastering key topics within Tableau, such as data preparation, exploratory data analysis, advanced analytics, integration with machine learning, and data storytelling, you can unlock the full potential of your data and drive more impactful insights and decisions in your data science projects. Whether you're a data scientist, analyst, or business user, Tableau offers a wealth of capabilities to help you extract value from your data and drive business success.
Join our WhatsApp Channel to get the latest news, exclusives and videos on WhatsApp
_____________
Disclaimer: Analytics Insight does not provide financial advice or guidance. Also note that the cryptocurrencies mentioned/listed on the website could potentially be scams, i.e. designed to induce you to invest financial resources that may be lost forever and not be recoverable once investments are made. You are responsible for conducting your own research (DYOR) before making any investments. Read more here.
