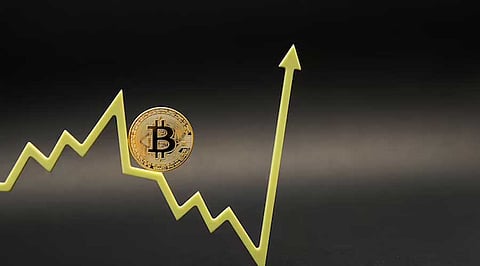
Bitcoin price has been recording lower highs and higher lows since turning away from its nine-month high on April 14. All recovery attempts have continuously been rejected by the resistance line of a symmetrical triangle since then. Consequently, BTC appears to be in a drab sideways price action with no clear directional bias.
Market participants were waiting to see the direction BTC price would take after experiencing a notoriously challenging trading environment in April. There have been breakouts, bull traps and sell-offs, which are now being consolidated into a narrative that would make sense for Bitcoin holders.
The price action has formed a series of higher lows and lower highs leading to the appearance of a symmetrical triangle on the daily chart. If the technical setup plays out correctly, then traders could witness a 13.11% rally for the flagship cryptocurrency on the upside from the triangle's resistance line. However, the movement could be in either direction.
At press time, BTC was exchanging hands at $28,262 with a bullish bias. If bulls manage to produce a daily candlestick close above $28,756, embraced by the 50-day Simple Moving Average (SMA), it could rise to confront reistance from the the upper trendline of the triangle at $29,482.
Rising above this level would confirm a bullish breakout toward the optmistic target of the technical chart pattern at $33,385. This would represent a 18.5% move up from the current price.
BTC/USD Daily Chart

The Relative Strength Index (RSI) has crossed the midline into the positive region. The price strength at 52 suggested that the buyers had began taking control of the price, justifying the optimistic outlook.
BTC's upside was also supported by increasing positive sentiment in the crypto market. Data from Alternative, a firm that analyzes "emotions and sentiments" around Bitcoin, revealed that social support has been intensifying for the crypto.
In the image (below), the Bitcoin Fear and Greed Index is still within the "Greed" zone despite the value slightly dipping from last week and last month.
According to Alternative, the position of the social sentiments within the"Greed" zone are indication that more investors are still buying. It also points to increasing investor interest in the big crypto.
Recovery may be realized if interest in the proof-of-work (PoW) crypto across social media platforms continues to increase.
The $28,143 level, embraced by both the triangle's ascending line, holds the short-term support for Bitcoin. As long as this support stays intact, buyers will have enough time to push for an uptrend.
On the downside, a break below the aforementioned level could see the sellers push the price below the triangle's lower trendline toward the April 24 swing low at $28,600. Such a move would bring the bearish scenario into the picture. A 13% decline could occur, landing BTC back into the $24,000 zone.
Join our WhatsApp Channel to get the latest news, exclusives and videos on WhatsApp
_____________
Disclaimer: Analytics Insight does not provide financial advice or guidance. Also note that the cryptocurrencies mentioned/listed on the website could potentially be scams, i.e. designed to induce you to invest financial resources that may be lost forever and not be recoverable once investments are made. You are responsible for conducting your own research (DYOR) before making any investments. Read more here.